Mar
31
Déjà vu
I had a feeling of déjà vu when I saw this week’s Makeover Monday dashboard.

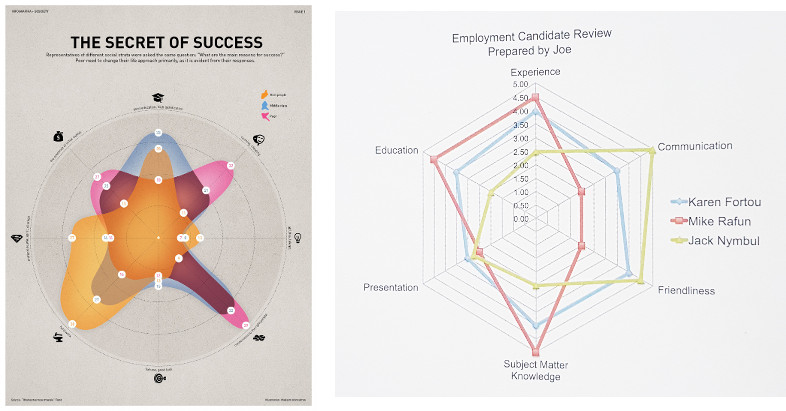
On the left, you have the Makeover Monday graph (http://visual.ly/secret-success) and on the right a graph from ‘Show me the numbers‘. The latter was used as a sample in the book to demonstrate how not to do visualisations.
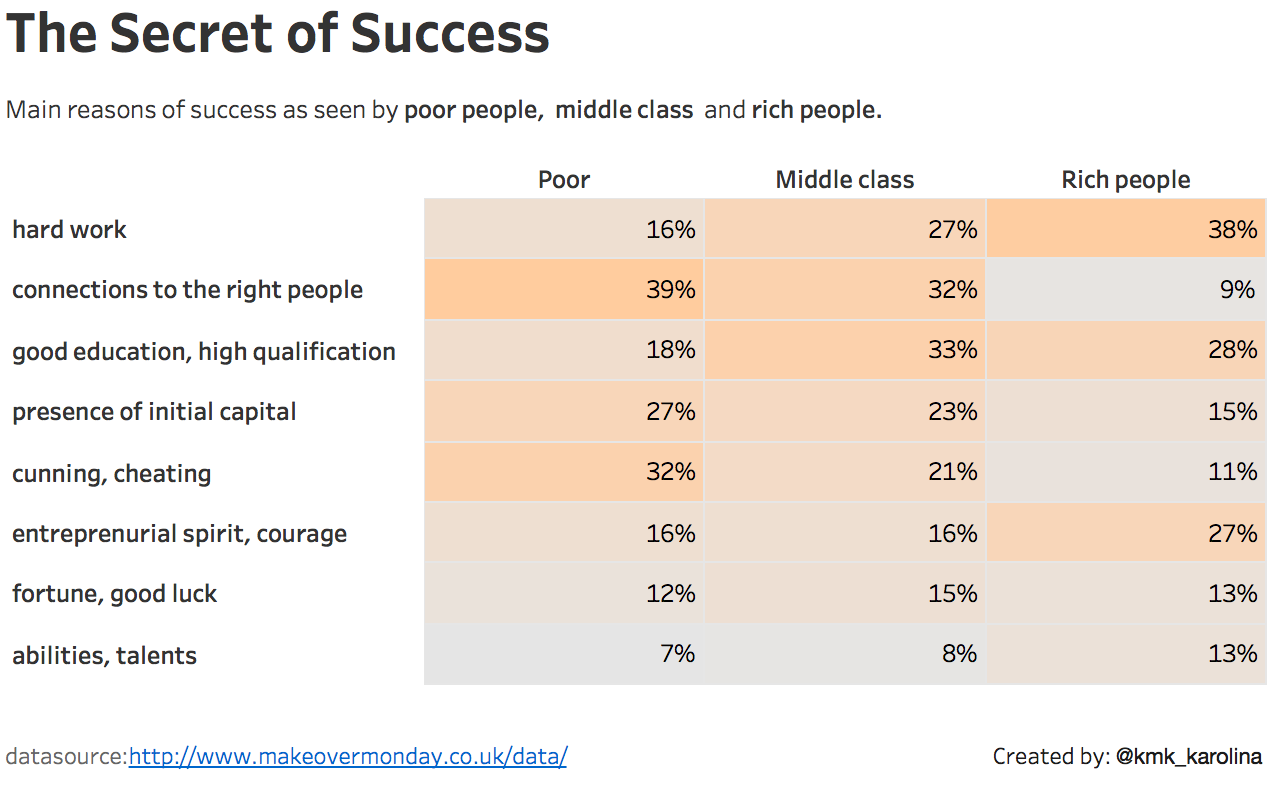
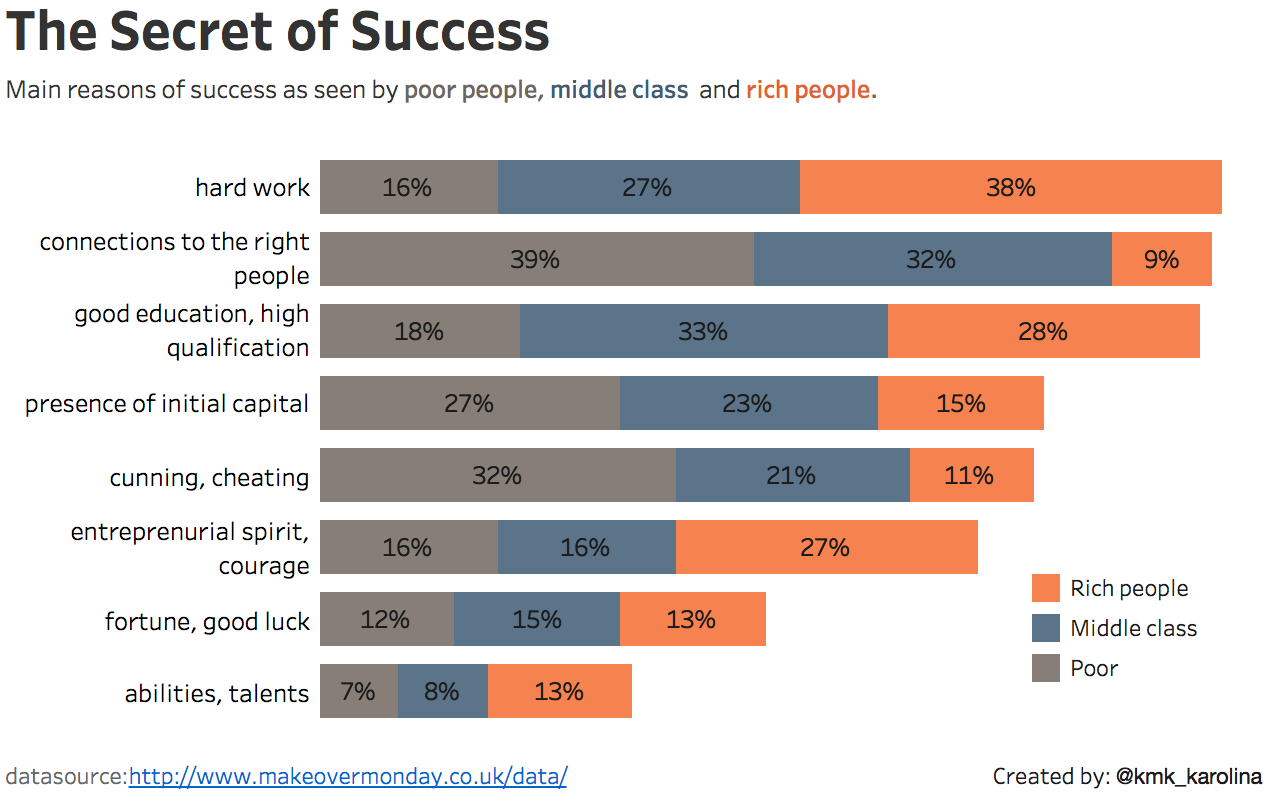
I agree with the author that a spider chart is confusing. Often a simple solution like presenting the data in a table works better. I decided to experiment with two simple approaches and prepared a table and a bar chart.


It’s now clear that both visualisations are much more readable than the spider graph.
Which one is better? Well, that’s up to you to decide.