The annual Tableau Conference on Tour in London (TCOT) took place from 5th to 7th June at Tobacco Dock.
Conference programme
Monday started with training sessions (which I didn’t attend) and a welcome reception in the evening. There was a live #makeovermonday event that also took place on Monday.
Tuesday began with a conference kick-off keynote by James Eiloart SVP EMEA at Tableau. It covered the future roadmap & new features. Some nice things coming out this year like Tableau Server for Linux. The day was full off breakout sessions, hands on training and customer presentations. There also was a ‘Data Night Out’ party.
Wednesday had a similar schedule. Except there was no party and instead we had IronViz Championship.
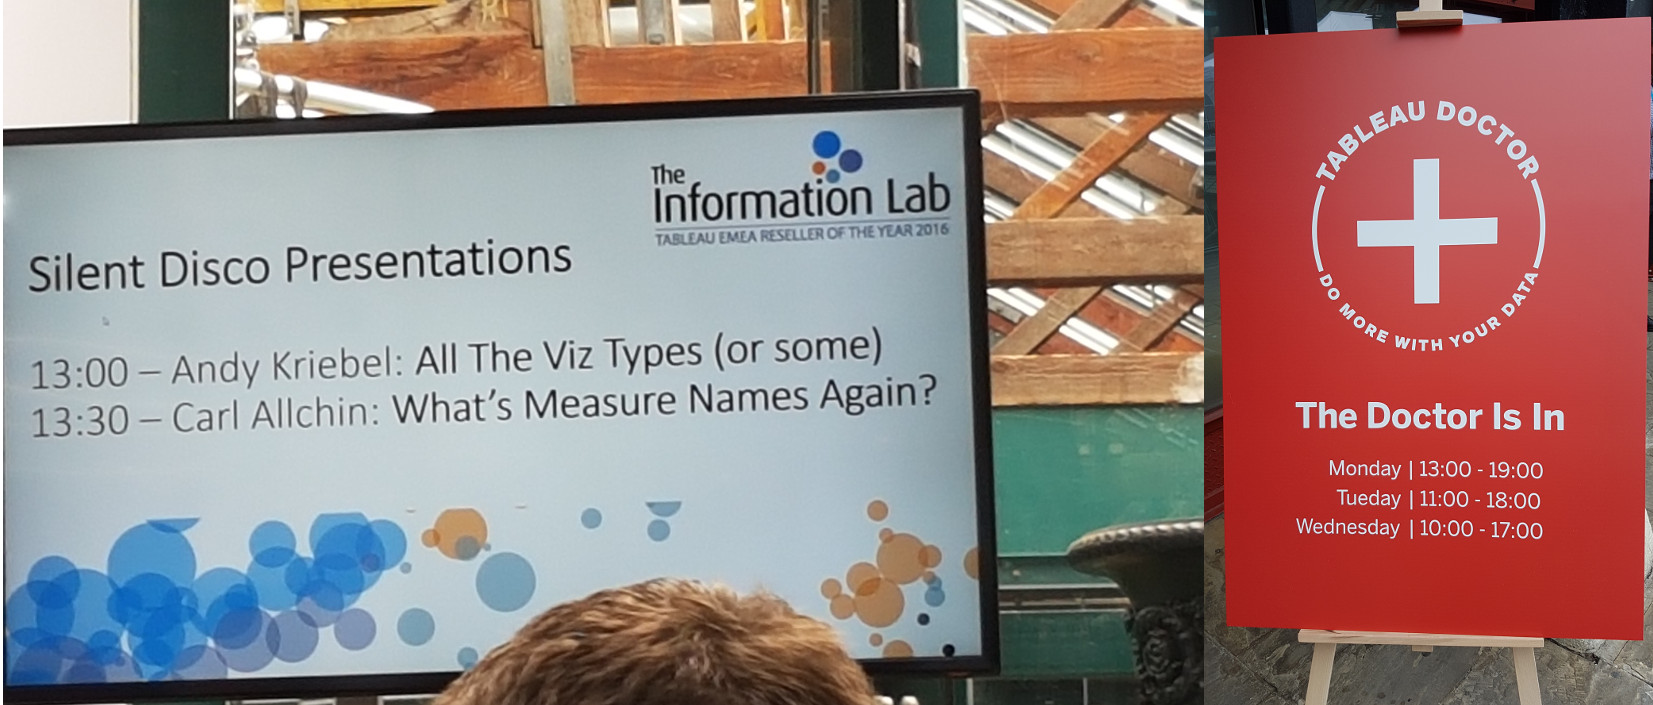
On both days Tableau Doctors were available – happy to help with small and big questions. One of the sponsors – The Information Lab – gave a few short but very informative talks during the brakes.

What I liked and what I would do differently.
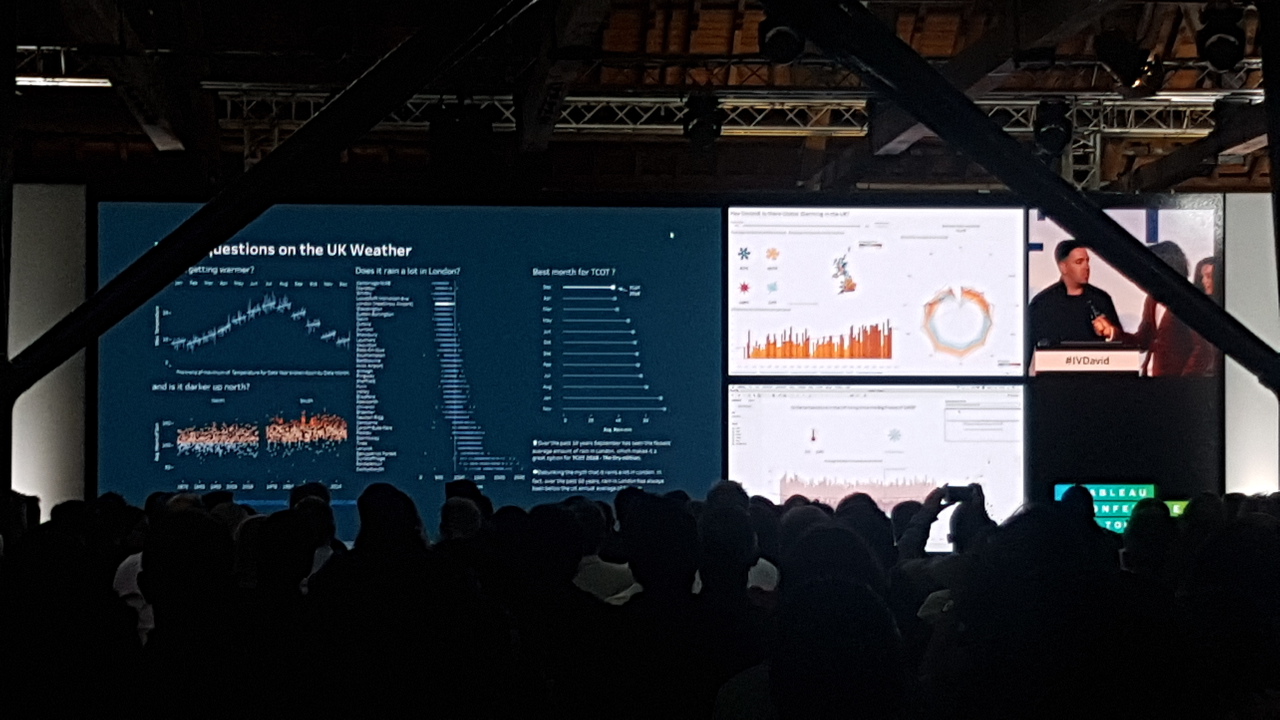
I enjoyed most of the sessions but there were a few that stood out. The hands-on training ‘Optimising Calculation Methods‘ was very insightful and informative. It was presented by Anna Flejéo and Tom Christian. It gave me a really good idea on how to decide when to use a calculated field, LOD expressions, or a table calculation. The second one I really liked was ‘Faster Dashboards with Performance Best Practices‘ presented by Mrunal Shridhar. I also enjoyed the keynote session by David Spiegelhalter: ‘Dodgy Data, Naughty Numbers, and Shabby Statistics‘. Very clever and entertaining. Not to mention IronViz Championship. Three contestants battled each other on the stage – who can make the finest visualisation in 20 minutes. To my great joy, won the competition. Here’s David’s winning viz, impressive!

The conference was fun but there’s one thing I’d do differently. I’d go to more hands-on sessions. I attended 3 where I could go to 4. I was told that some breakout sessions were recorded and will be shared but the hands-on weren’t. Well, that was my first TCoT – next time I’ll know better 🙂
A few tips for the next year
- Make a plan A and a plan B for each time slot. Some sessions are really popular. One of the breakout sessions I attended was so full that people had to stand. Unfortunately, the hands-on sessions were strictly limited and people were simply turned away.
- If you really want to be is a session – come early.
- You don’t need a laptop for the hands-on. They are provided, everything is setup and waiting for you.
See you next year!


