Key Data Science

RSS
Jun
19

Tableau Conference on Tour London 2017

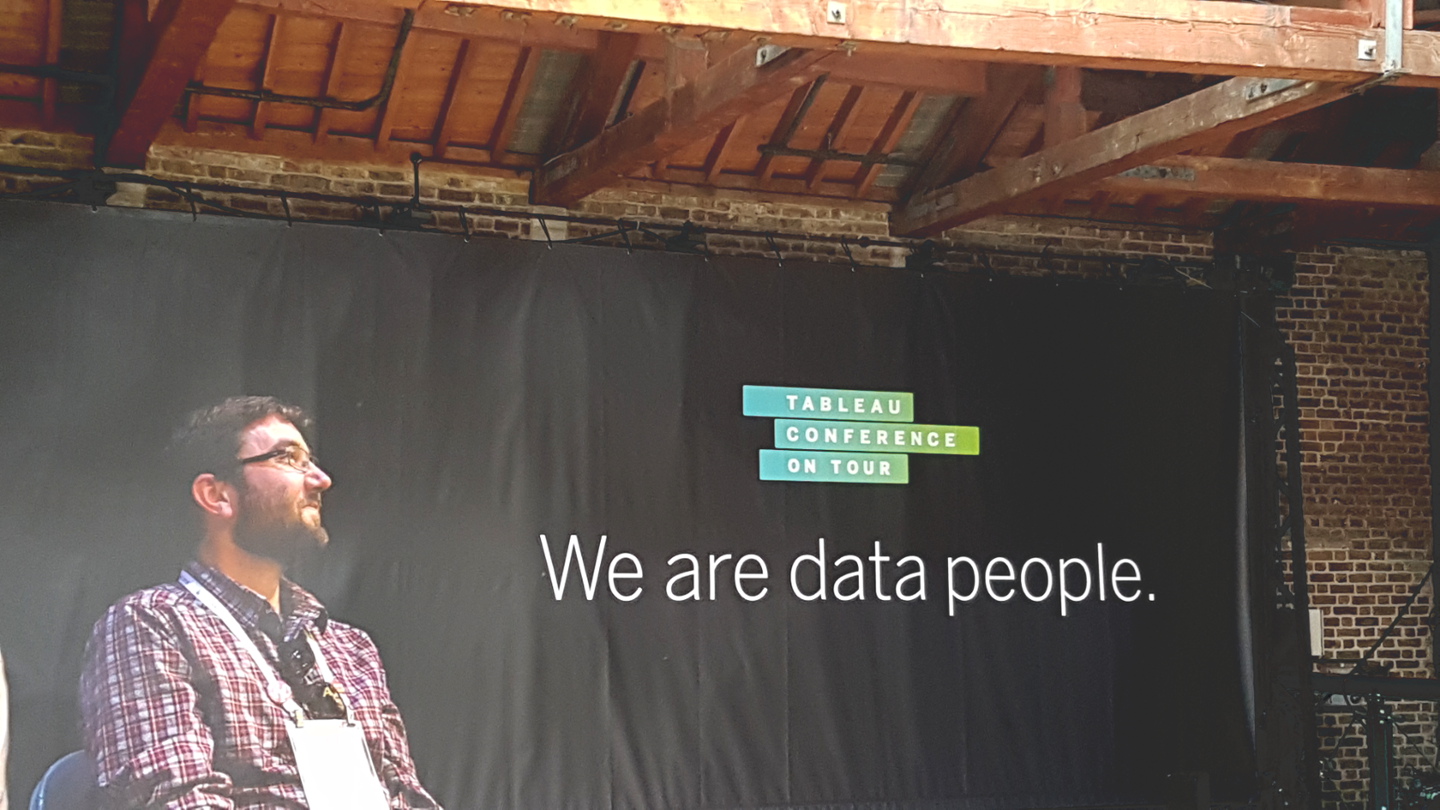
The annual Tableau Conference on Tour in London (TCOT) took place from 5th to 7th June at Tobacco Dock.

Conference programme

Monday started with training sessions (which I didn’t attend) and a welcome reception in the evening. There was a live #makeovermonday event that also took place on Monday.

Tuesday began with a conference kick-off keynote by James Eiloart SVP EMEA at Tableau. It covered the future roadmap & new features. Some nice things coming out this year like Tableau Server for Linux. The day was full off breakout sessions, hands on training and customer presentations. There also was a ‘Data Night Out’ party.

Wednesday had a similar schedule. Except there was no party and instead we had IronViz Championship.

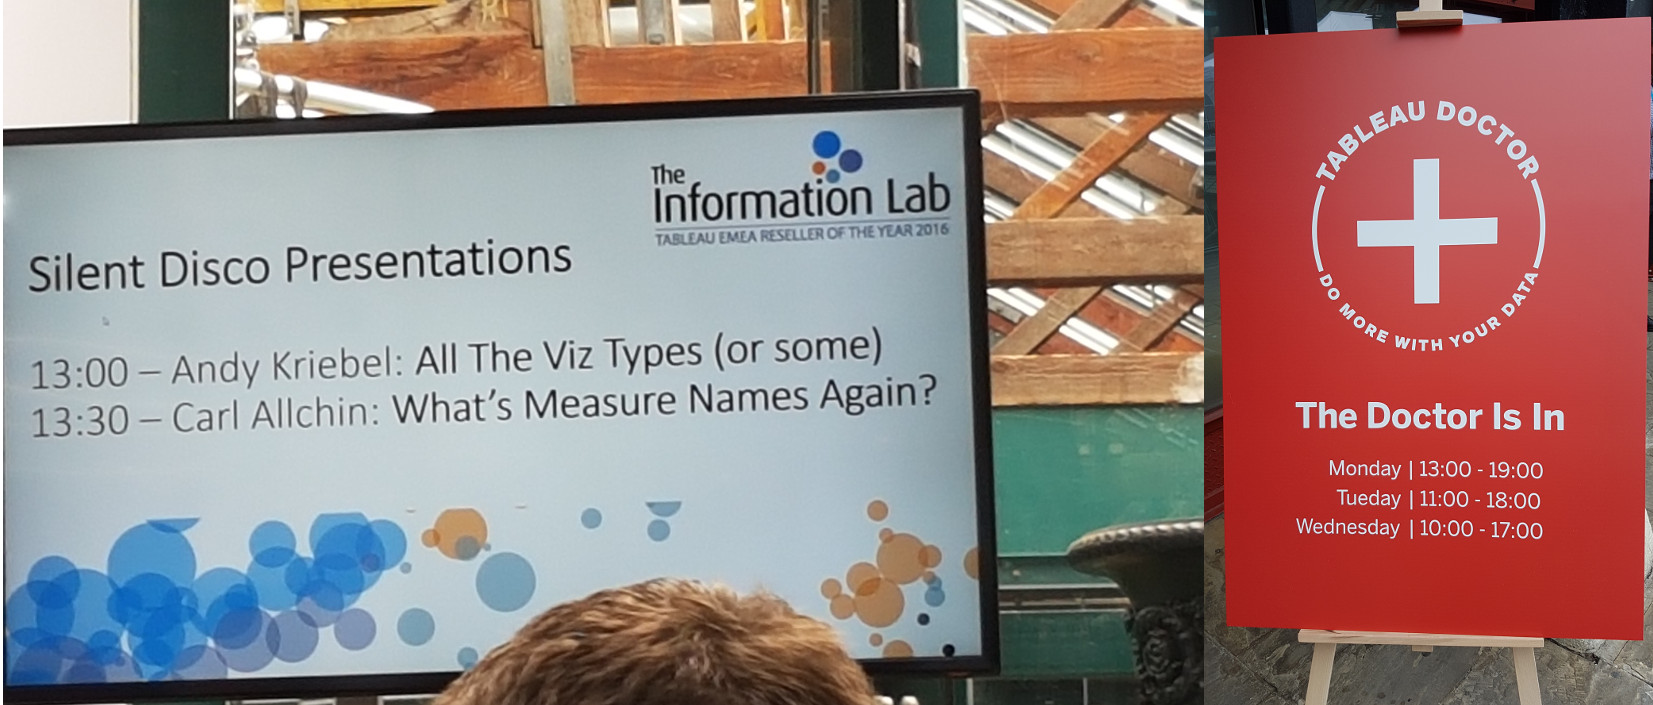
On both days Tableau Doctors were available – happy to help with small and big questions. One of the sponsors – The Information Lab – gave a few short but very informative talks during the brakes.


What I liked and what I would do differently.

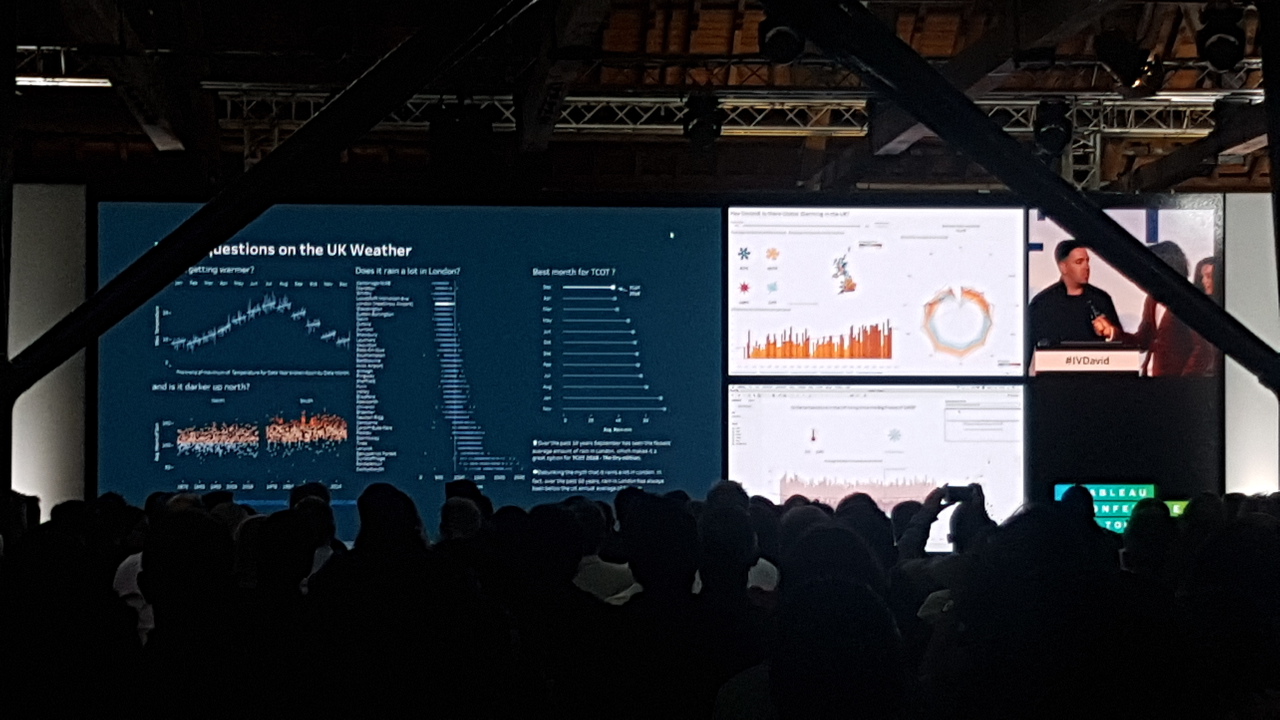
I  enjoyed most of the sessions but there were a few that stood out. The hands-on training ‘Optimising Calculation Methods‘ was very insightful and informative. It was presented by Anna Flejéo and Tom Christian. It gave me a really good idea on how to decide when to use a calculated field, LOD expressions, or a table calculation.  The second one I really liked was ‘Faster Dashboards with Performance Best Practices‘ presented by Mrunal Shridhar. I also enjoyed the keynote session by David Spiegelhalter: ‘Dodgy Data, Naughty Numbers, and Shabby Statistics‘.  Very clever and entertaining. Not to mention IronViz Championship. Three contestants battled each other on the stage – who can make the finest visualisation in 20 minutes. To my great joy, @davidmpires won the competition.  Here’s David’s winning viz, impressive!

The conference was fun but there’s one thing I’d do differently. I’d go to more hands-on sessions. I attended 3 where I could go to 4. I was told that some breakout sessions were recorded and will be shared but the hands-on weren’t.  Well, that was my first TCoT – next time I’ll know better 🙂

A few tips for the next year
  • Make a plan A and a plan B for each time slot. Some sessions are really popular. One of the breakout sessions I attended was so full that people had to stand. Unfortunately,  the hands-on sessions were strictly limited and people were simply turned away.
  • If you really want to be is a session – come early.
  • You don’t need a laptop for the hands-on. They are provided, everything is setup and waiting for you.

 See you next year!

Tableau Comments Off on Tableau Conference on Tour London 2017
Mar
15

Am I sexist?

We were riding on a chairlift when my other half noticed that there’s still quite a lot of people out there skiing or snowboarding without a helmet. My first reaction was: “Yes and look, most of them are men!”

But after having a second look (down), I pondered: Is it more men not wearing helmets or is it just because there are fewer women on the slopes?

After a cracking day, going up and down the mountain, that evening I sat down with a glass of wine and did some serious digging. On the SkiClub website I found a consumer research paper on snowsports with some interesting data. SkiClub is the biggest membership-based snowsports club in the UK.

Well, it doesn’t look good – there is indeed fewer women on the slopes, and the numbers are falling. As for the helmets, different sources provide slightly different numbers – from 64% to 88% of people on the slopes ride with a helmet. For this exercise, I settled on the 80% figure which seems representative.

Great, so it looks I’m not sexist after all! Without taking into account other factors (age, gender differences, risk-taking behaviour, etc.), it’s simply because there are more men on the slopes. This makes men more like likely to be spotted without a helmet.

Statistics, Tableau , , , Comments Off on Am I sexist?
Feb
28

Data visualisations with Tableau

I’ve been recently taking part in Makeover Mondays.  It’s an exciting challenge and an excellent way to improve your Tableau skills whenever you have some spare time. The Chicago Taxis challenge was one of the most enjoyable to complete. It offered a live Exasol connection to all 105 million records. The Exasol is an in-memory database, and I must admit it works like a charm with Tableau.

Tableau gives you a nice visual interface for join data sets. It’s very user-friendly especially for beginners and works pretty well compared to other reporting tools I’ve used. tableau1

What’s not so great about Tableau is the way it treats custom SQL. I come from DBA background and can write efficient SQL queries much faster than I can click things on the GUI. Despite the fact that Tableau accepts custom SQL it’s not something recommended and surprisingly tends to be slower to fetch data. I guess that’s due to the way Tableau refactors the query in the background. I noticed that the query is issued inside of a subquery which often leads to poor performance.

Tableau has a pretty good map functionality. It’s great but still slightly limited.  Only the US region has the most detailed built-in maps. But there’s an option to use a custom geocoding, add own map layers should you want to.

The recently released version 10.2  (28 Feb 17)  comes with much improved geo-mapping capabilities. I’m eager to upgrade and take it for a spin.

tableau2

The dashboards are highly interactive and it makes the data presented very visually attractive.

chicago taxis

The only downside of Tableau is that it doesn’t run on Linux and I use Linux as my main desktop.

Data Viz, Tableau Comments Off on Data visualisations with Tableau
Nov
15

Tabelau and Email

From time to time I need to send a report to someone without the tableau online licence. If for any reason you have to do it daily this manual task can quickly become a burden.

Luckily there is a (limited) way to automate it with a bit of scripting. It gives an option of sending a pdf, png, csv for views and workbooks (not recommended from the security point of view – especially if your data is sensitive!!). A Windows box is needed for this – which is not ideal.

The first step is to download and install the tabcmd tool.

The next step is to script everything using your favourite scripting language. I went with PowerShell as this must be run on Windows. Here is a proof of concept script that does the absolute minimum:

# Clean the old report
If (Test-Path C:\pstmp\report_file.csv){
Remove-Item C:\pstmp\report_file.csv
}

# Set up a connection to Tableau Online
$command = @'
cmd.exe /C "C:\Program Files\Tableau\Tableau Server\9.0\extras\Command Line Utility\tabcmd.exe" login -s http://10ay.online.tableau.com/ -u USER -p PASSS
'@

Invoke-Expression -Command:$command

## Refresh and pull report
$command2 = @'
cmd.exe /C "C:\Program Files\Tableau\Tableau Server\9.0\extras\Command Line Utility\tabcmd.exe" get /views/path_toview/view_name.csv?:refresh=yes -f C:\pstmp\report_file.csv
'@

Invoke-Expression -Command:$command2

## Email credential
$pwd = ConvertTo-SecureString ‘PASSS’ -AsPlainText -Force
$cred = New-Object System.Management.Automation.PSCredential [email protected],$pwd

## Send the email
$param = @{
SmtpServer = 'smtp details'
Port = 587
Credential = $cred
UseSSL = $true
From = '[email protected]'
To = @('[email protected]';'[email protected]')
Subject = 'Blog daily report'
Body = "Blog daily"
Attachments = 'C:\pstmp\report_file.csv'
}

Send-MailMessage @param

Please note that this is just a PoC. Please be advised that storing username/password in a script is a security issue. Also, it’s a good idea to create a generic email address just for this purpose rather than sending it from your personal one.

Finally you will find is more documentation about tabcmd here.

Tableau Comments Off on Tabelau and Email